Analytics Dashboard
The Analytics tab provides a high-level summary of extraction performance across your entire document set.
While the Mismatch Matrix shows field-by-document detail, the Analytics Dashboard gives you the aggregate picture at a glance.
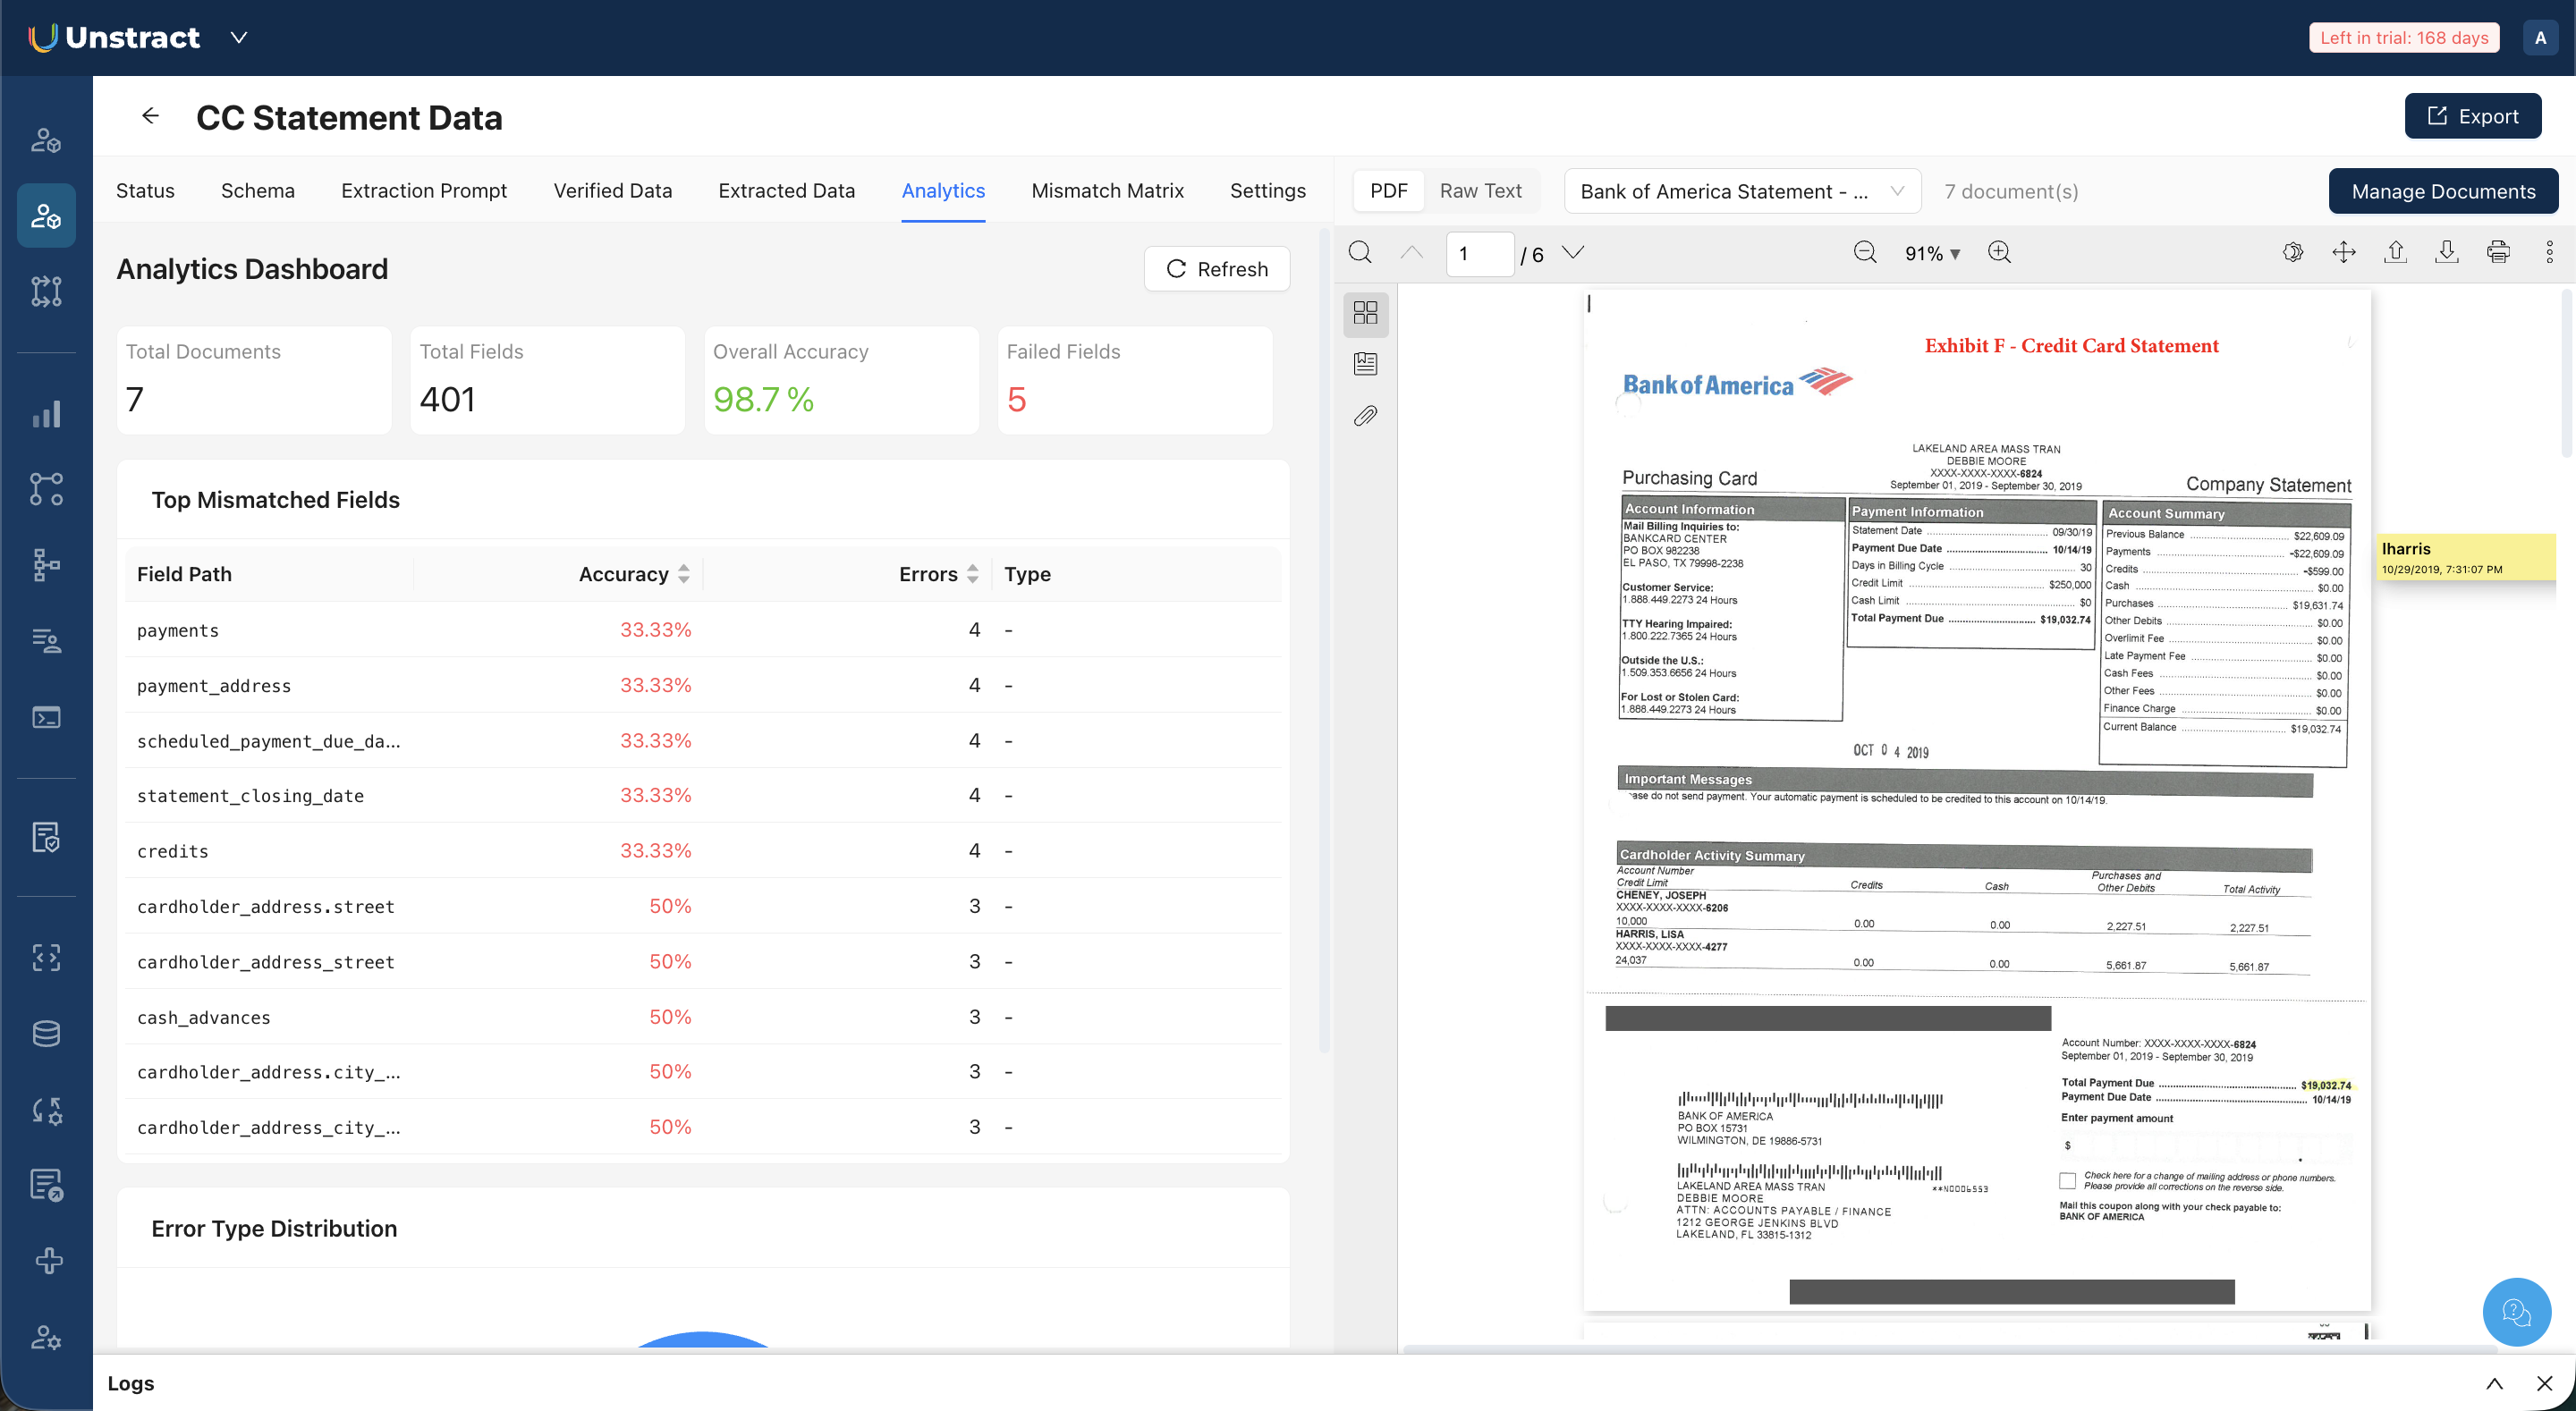
At the top, the dashboard displays four summary metrics:
| Metric | Description |
|---|---|
| Total Documents | Total documents in the project |
| Total Fields | Total fields identified across all documents |
| Overall Accuracy | Accuracy as a percentage |
| Failed Fields | Fields with at least one mismatch across any document |
Below the summary, the Top Mismatched Fields table lists the fields with the lowest accuracy, ranked by error count. Each row shows the field path, its accuracy percentage, and the number of errors.
This tells you immediately which fields are causing the most extraction failures across your document set, and therefore where prompt refinement effort will have the most impact.
Clicking a field name in the Top Mismatched Fields table opens a Field Detail dialog. This dialog shows the field's accuracy percentage and lists every document where a mismatch occurred, with the verified value and extracted value displayed side by side for each.
Click Refresh to update the dashboard after making changes to prompts, extraction results, or verified data.