Review Accuracy and Comparison
Once you have both extracted data and verified data for your documents, Agentic Prompt Studio provides multiple tools for measuring extraction quality and identifying issues.
Project Accuracy
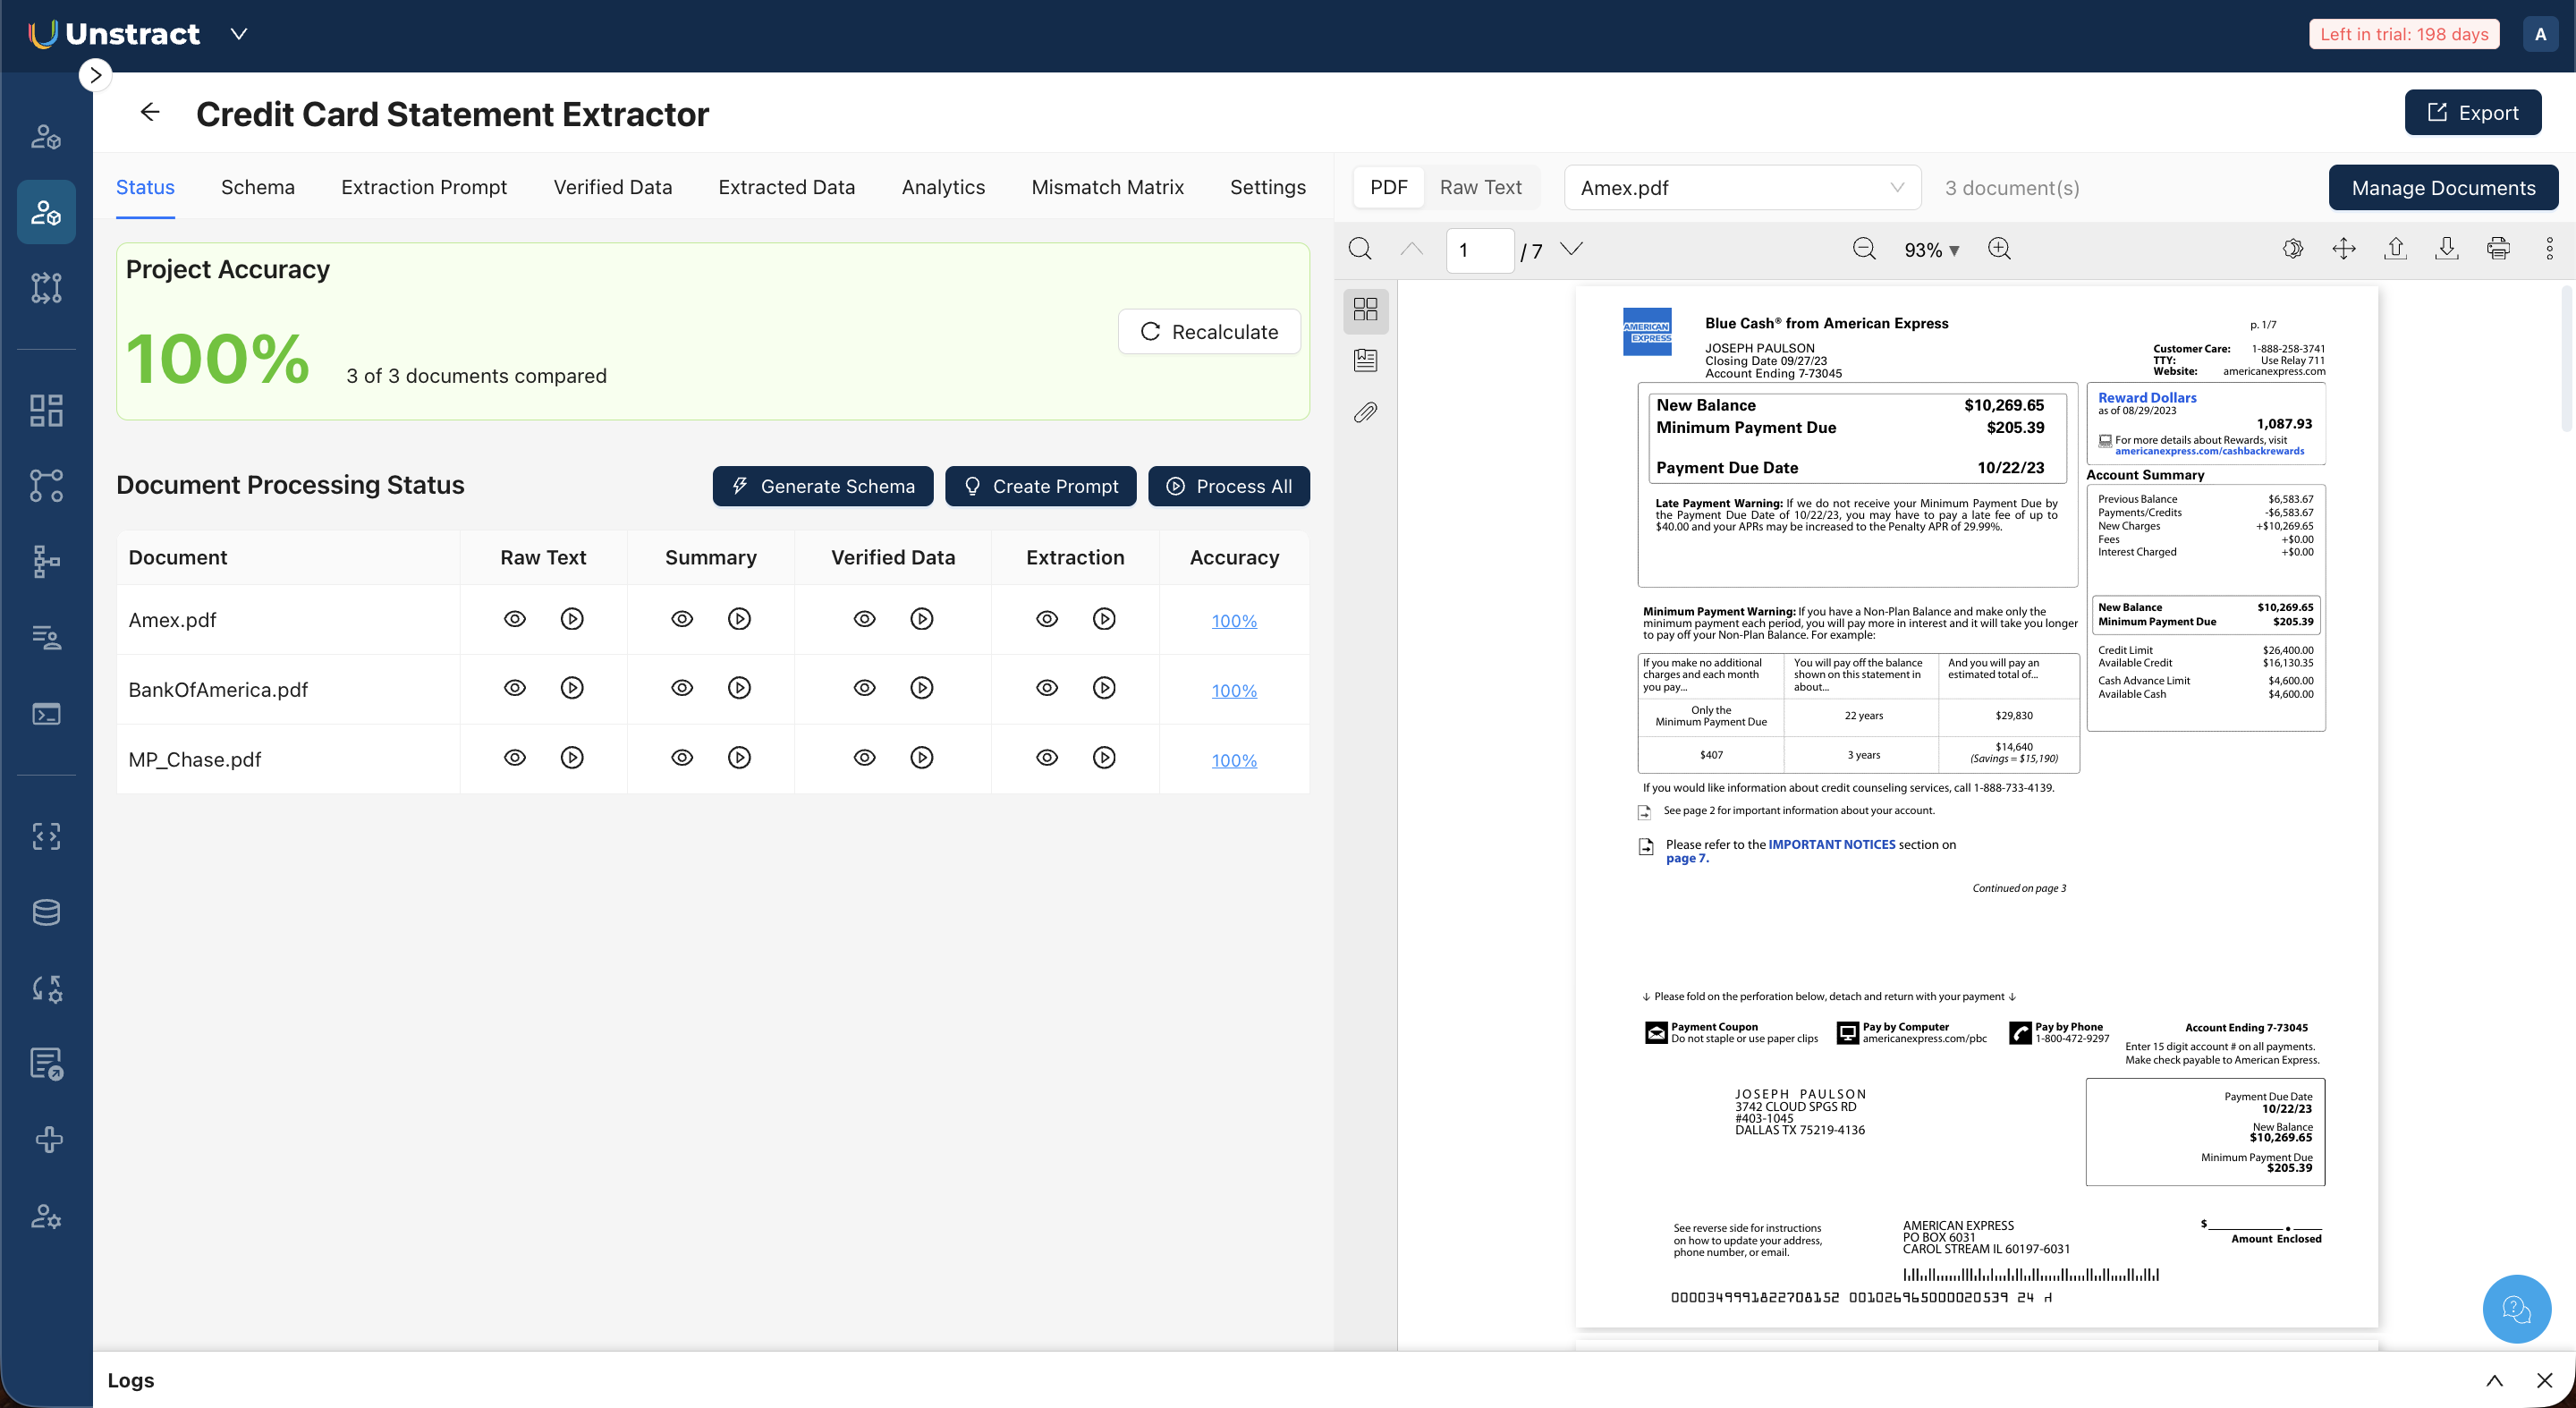 The Status tab displays a Project Accuracy percentage at the top: this represents how many fields across all documents match their verified baselines. Each document also has an individual accuracy score in the Accuracy column of the processing table.
Click Calculate Accuracy to compute accuracy based on current extraction results and verified data. If accuracy has been calculated previously and you have made changes since, click Recalculate to update the scores.
Field Comparison
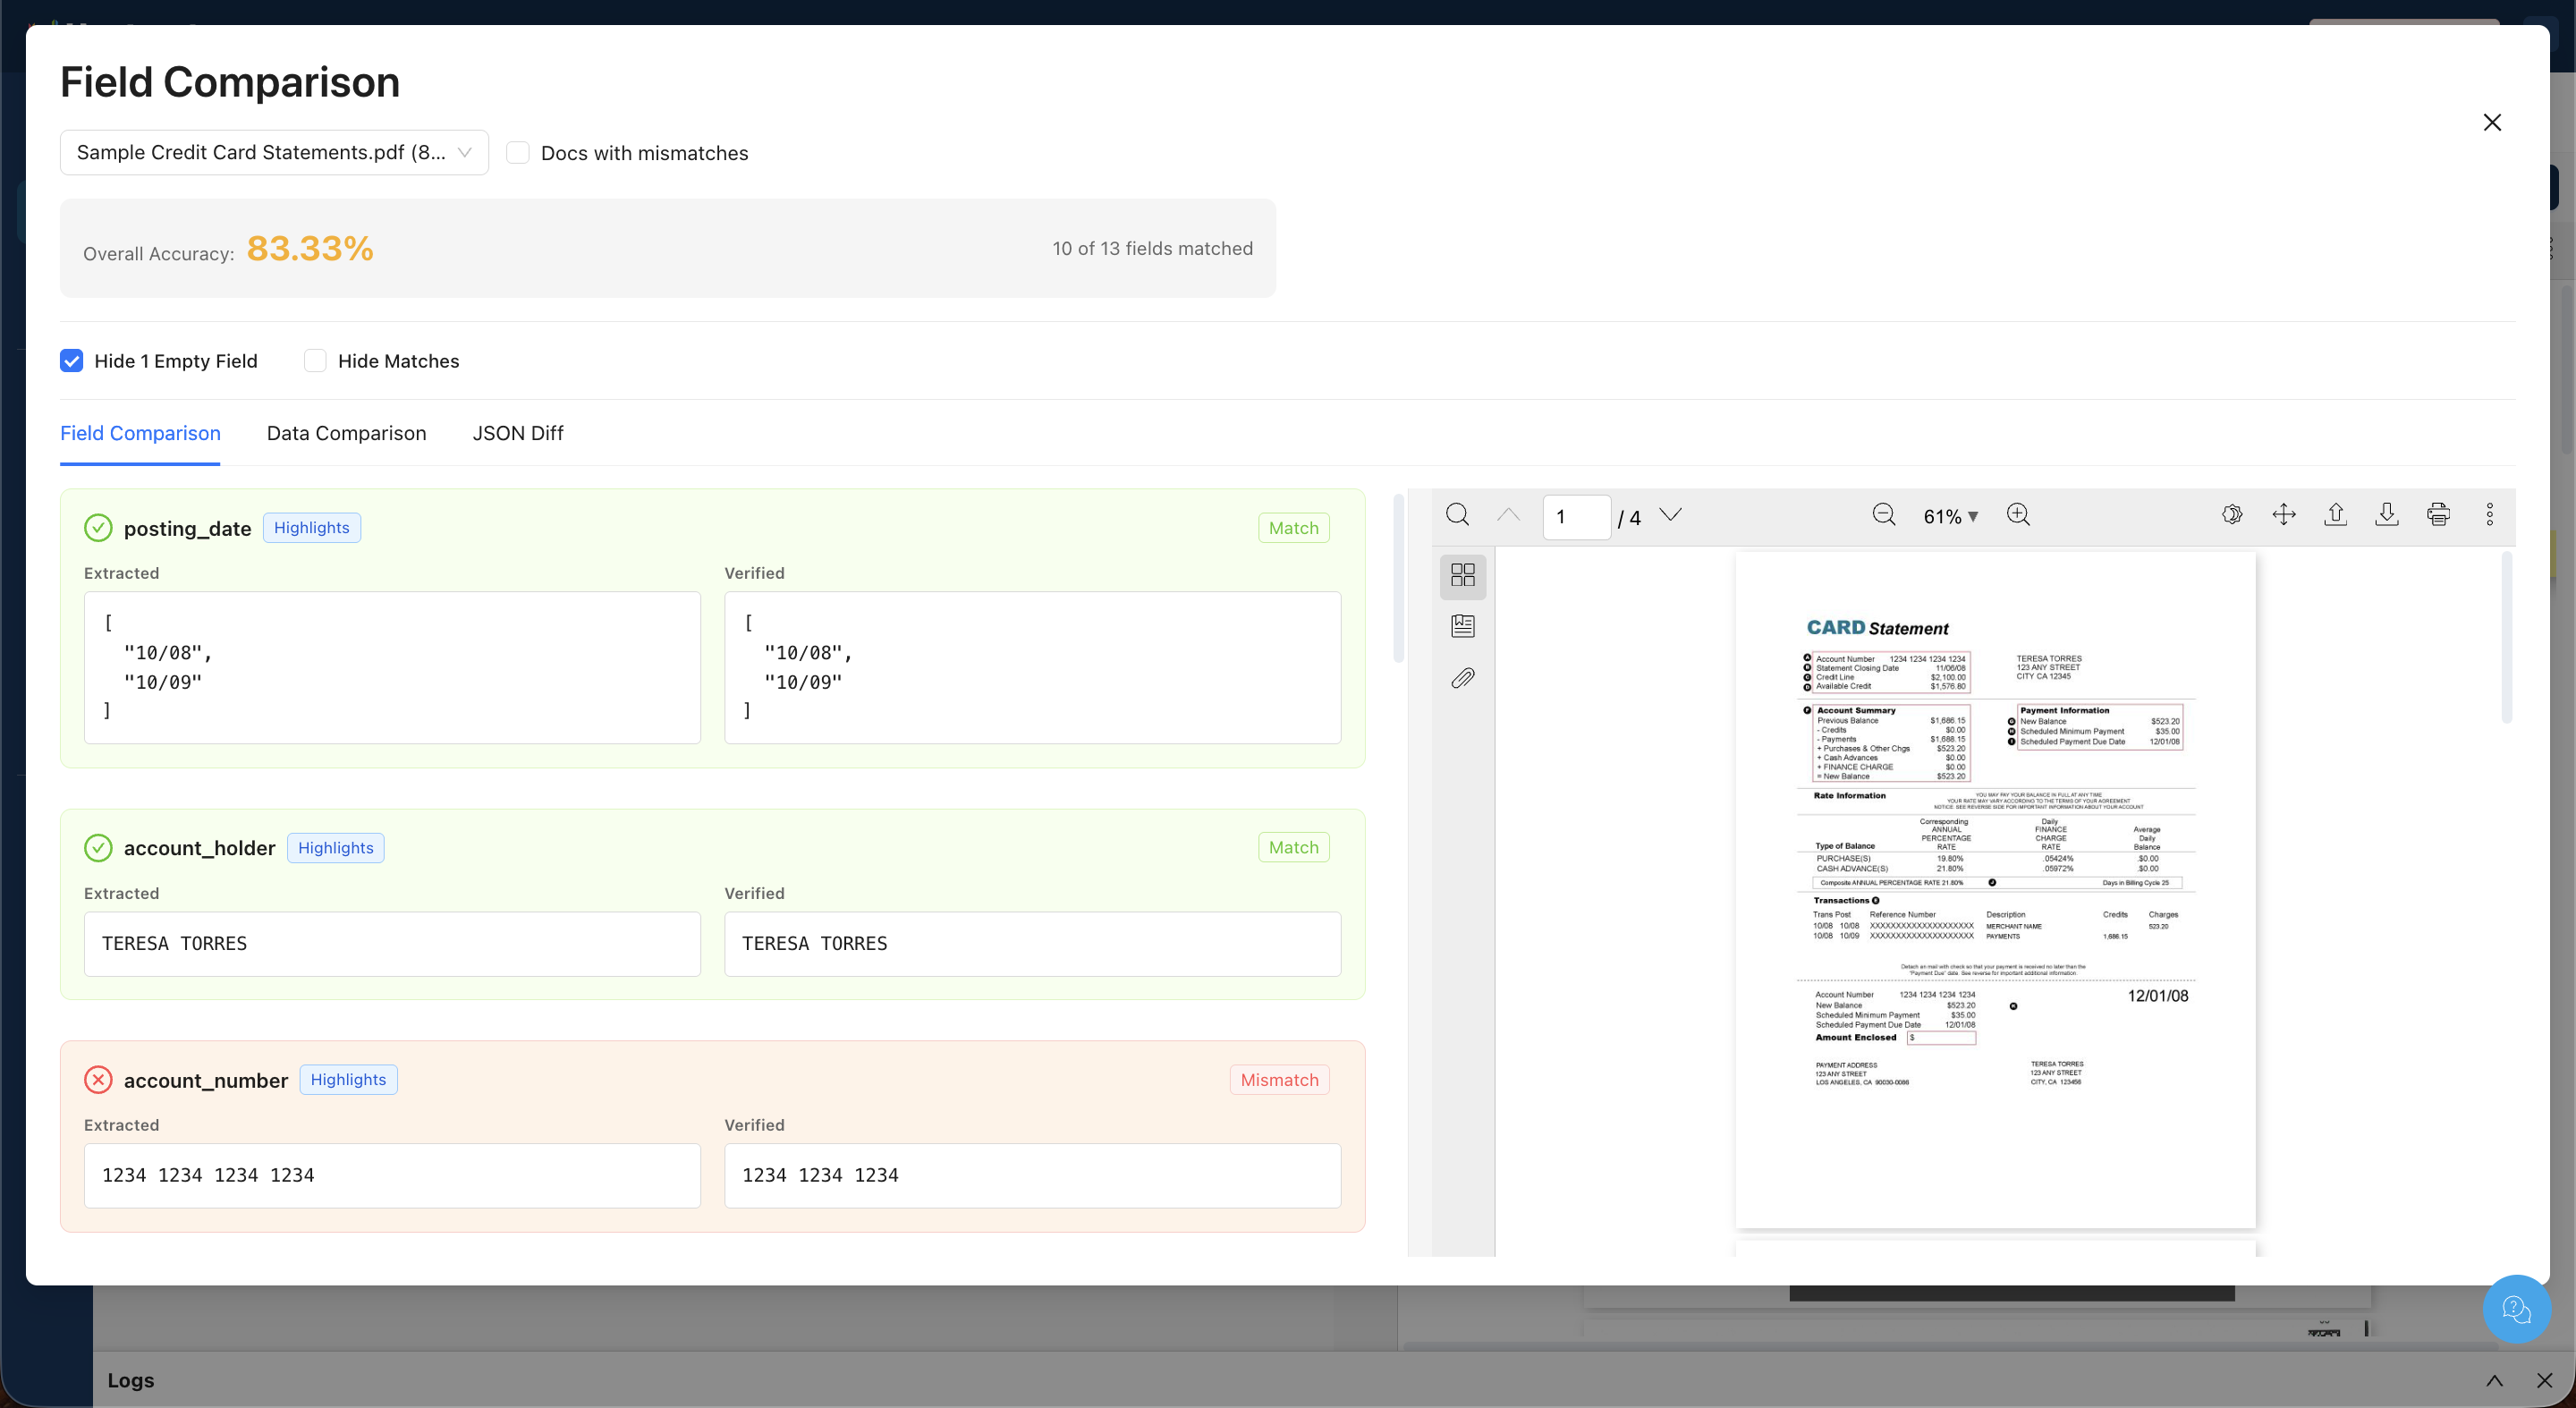 Click an accuracy percentage for any document to open the Field Comparison dialog. This shows exactly what matched and what didn't for that specific document.
Field Comparison Tab
Field Comparison Tab shows each field as a card with its extracted value and verified value side by side. Fields are labeled as Match (checkmark) or Mismatch (X). Clicking Highlights on a field highlights the corresponding location in the PDF preview.
The Field Comparison dialog provides three viewing tabs:
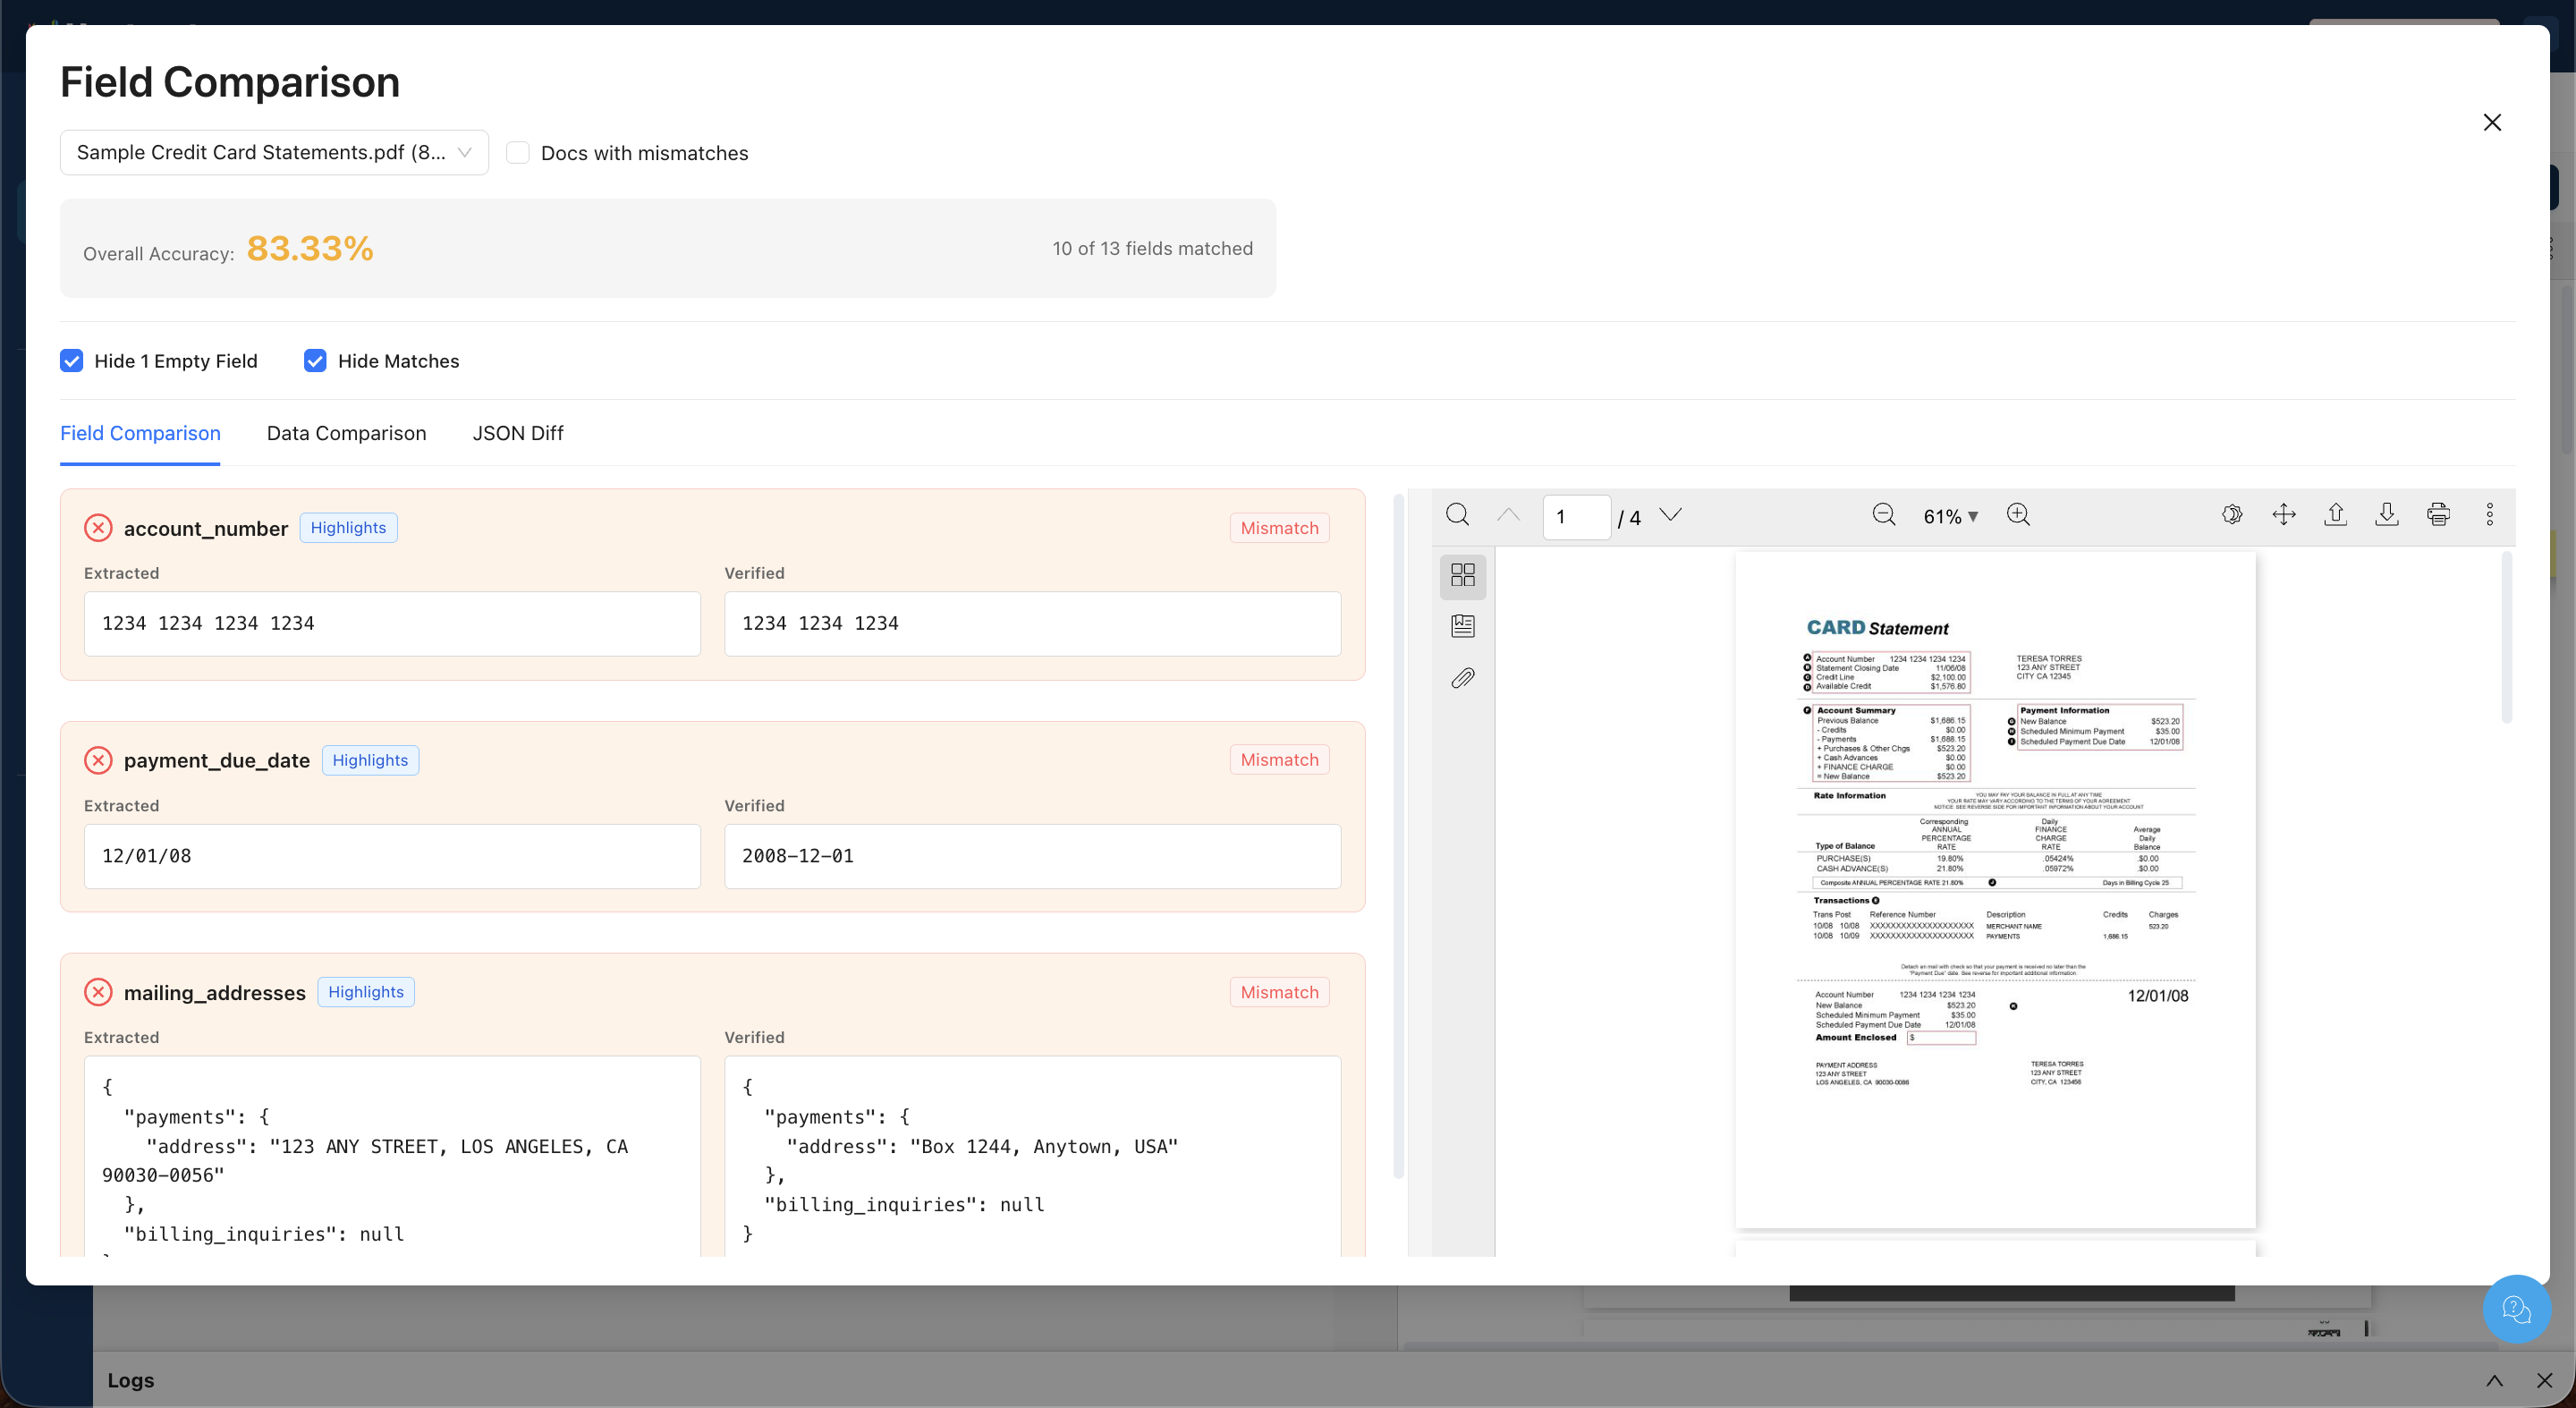
You can filter the view using:
- Hide Empty Fields — Removes fields where both extracted and verified values are empty.
- Hide Matches — Shows only mismatched fields, making it easier to focus on errors.
- Docs with mismatches — Filters the document dropdown to only documents that have at least one mismatch.
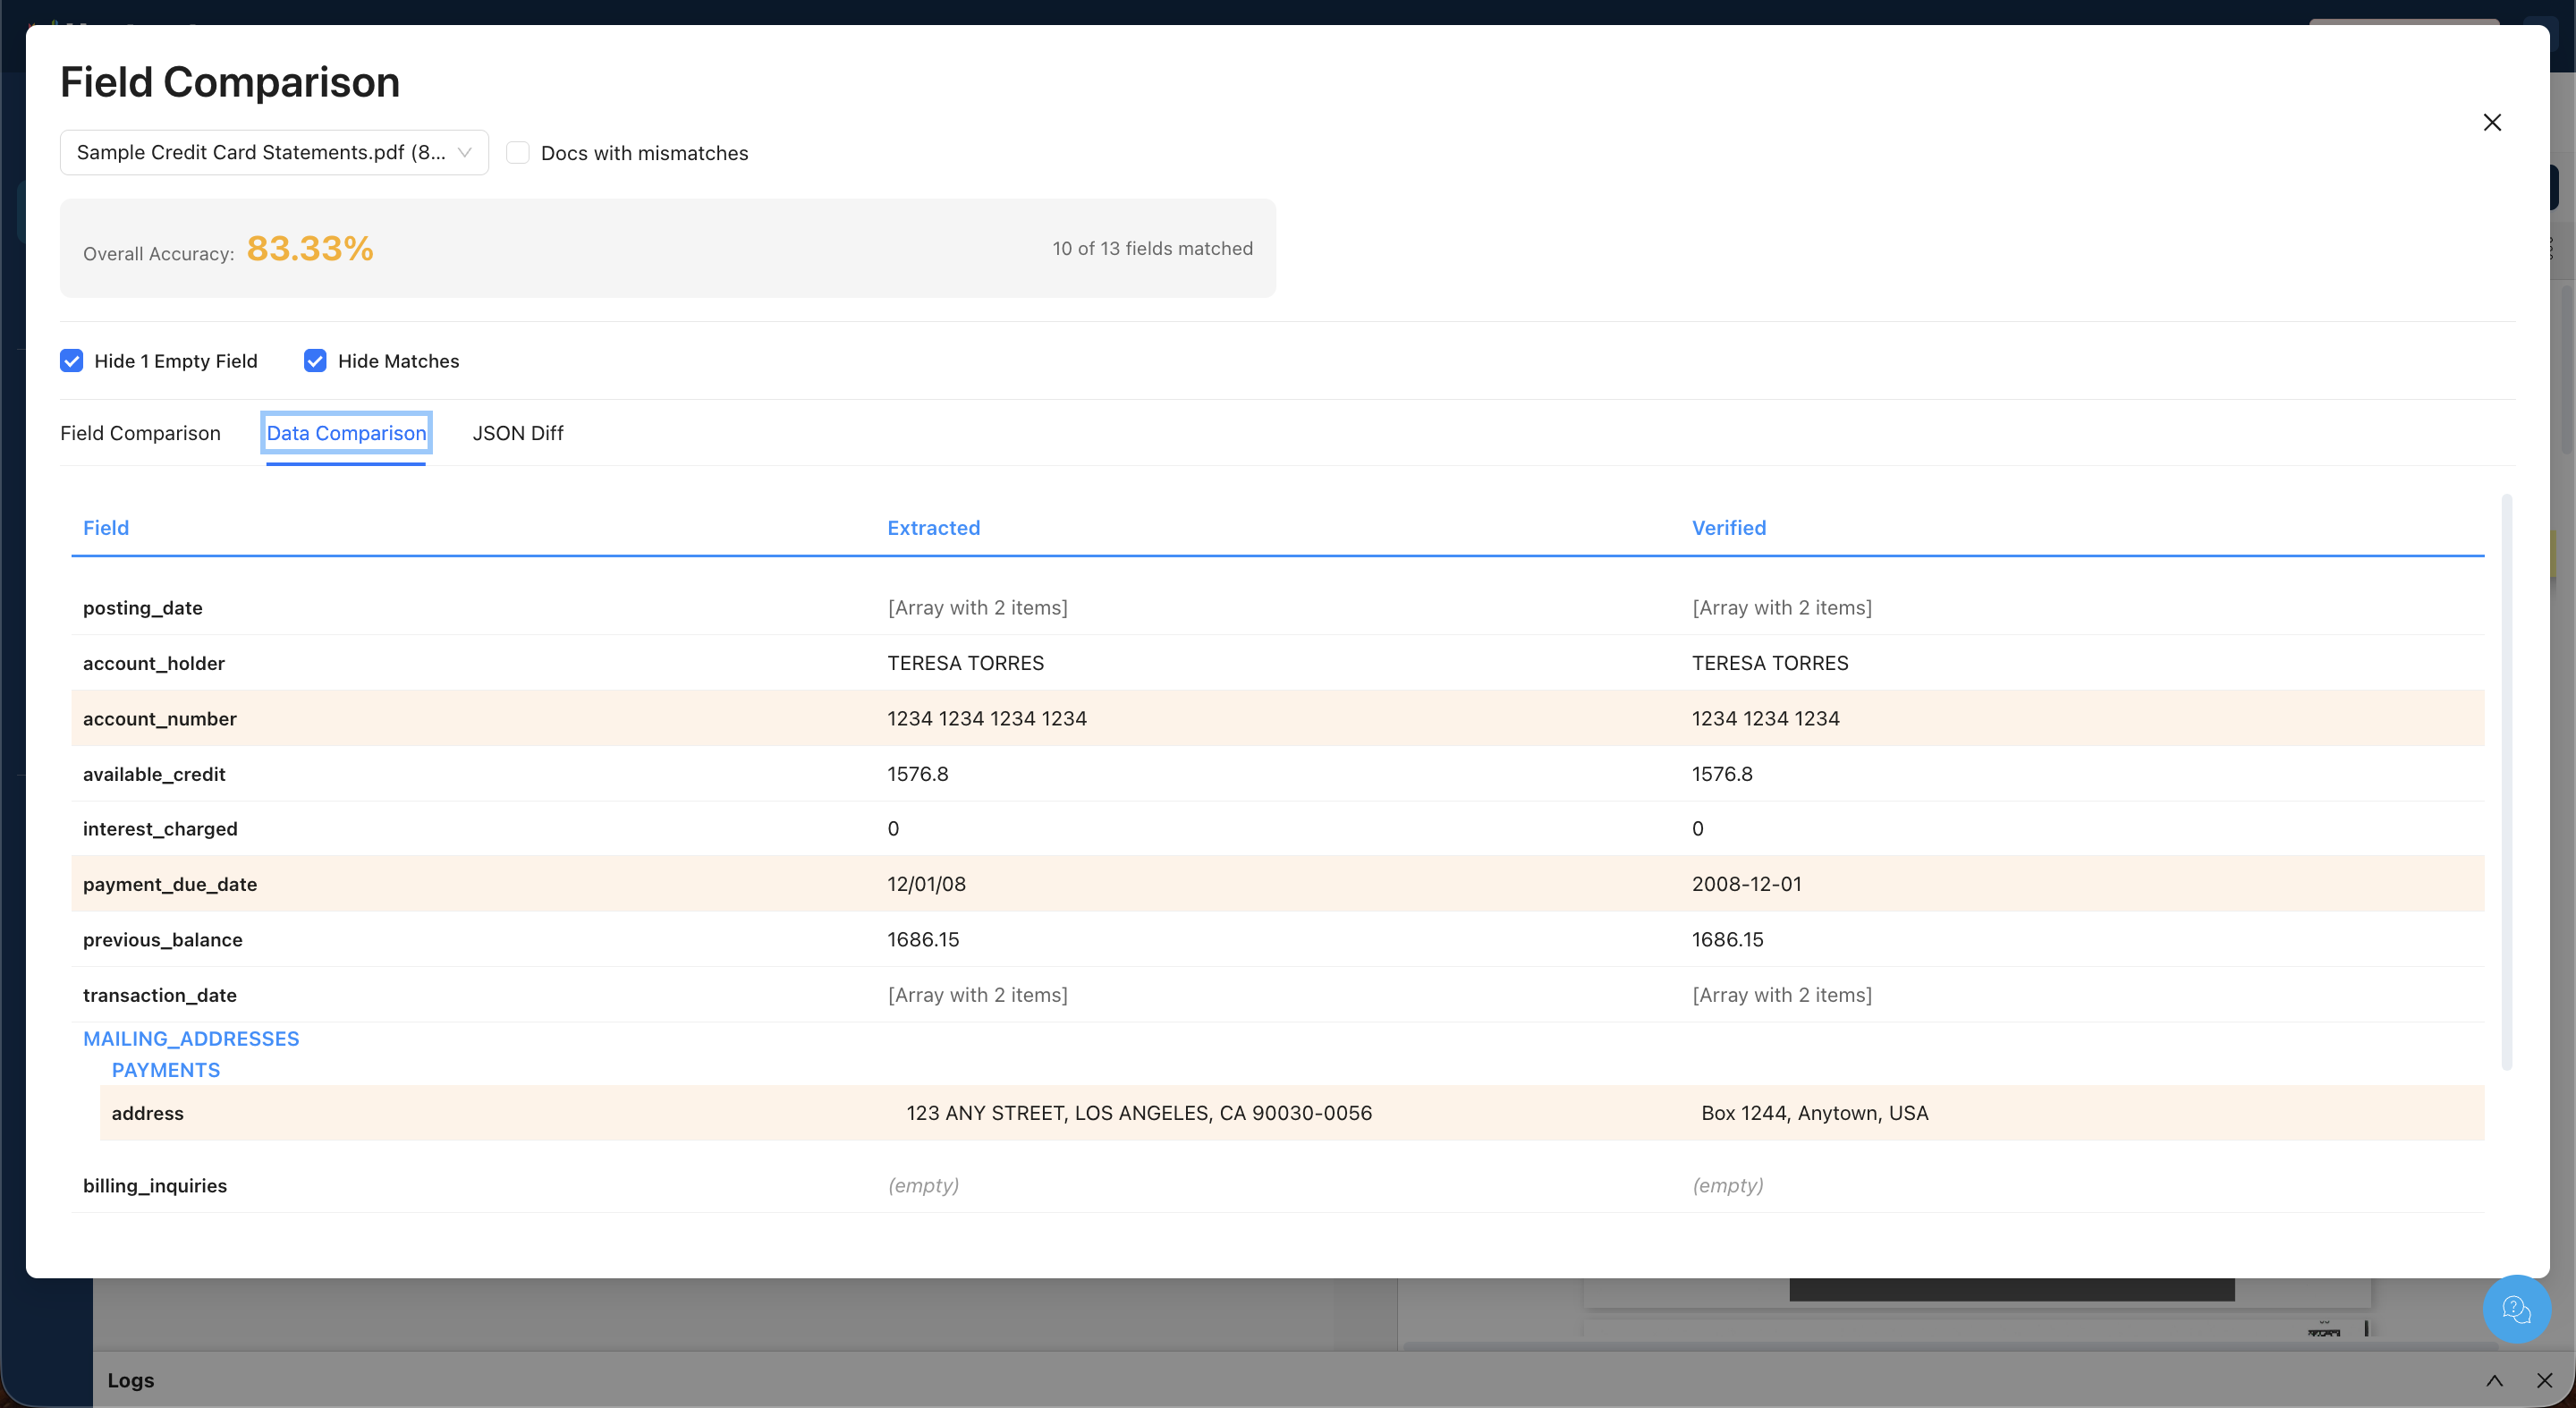
Data Comparison Tab
A compact table view showing Field, Extracted, and Verified columns for all fields. Mismatched rows are highlighted with a tan/yellow background. This provides a quicker overview than the card-based Field Comparison view.
JSON Diff Tab
A side-by-side code diff of the extracted and verified JSON. Lines with differences are highlighted — red on the extracted (left) side, green on the verified (right) side. This is useful for seeing the exact textual differences in the full JSON output.
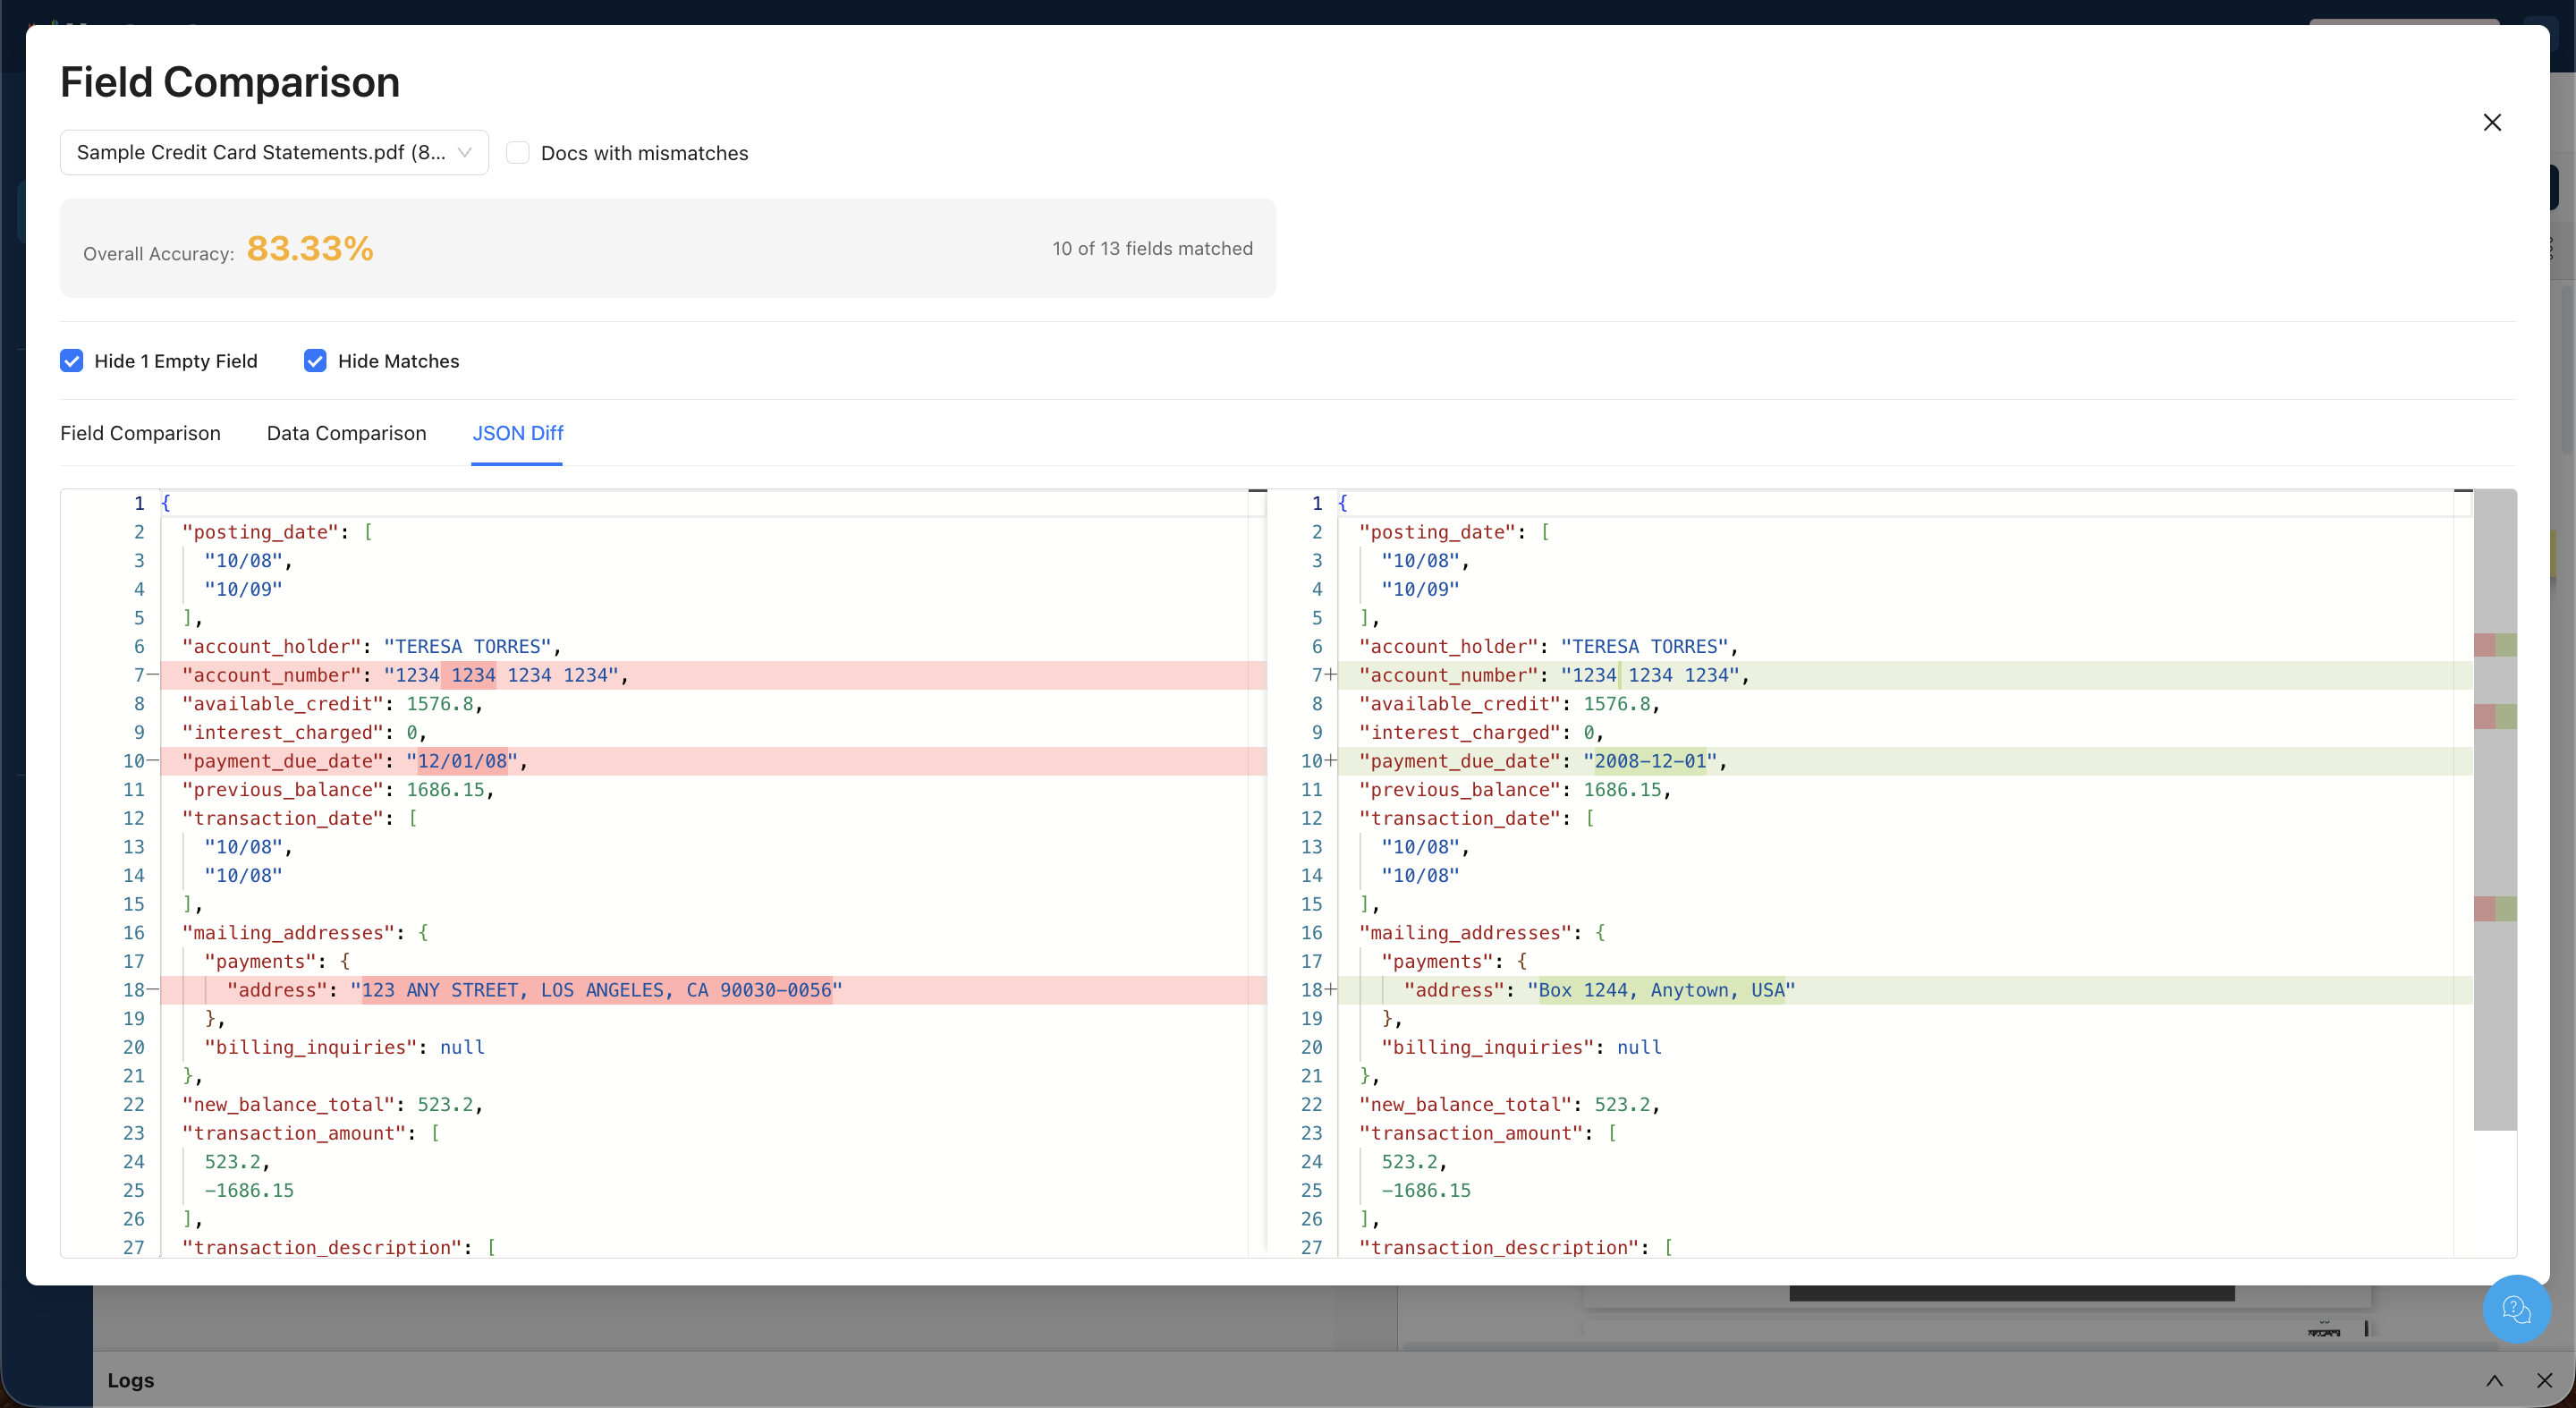
The header of the Field Comparison dialog always shows the Overall Accuracy percentage and the count of matched fields (e.g., "10 of 13 fields matched").
Mismatch Matrix
The Mismatch Matrix tab provides a bird's-eye view of extraction accuracy across all documents and all fields at once.
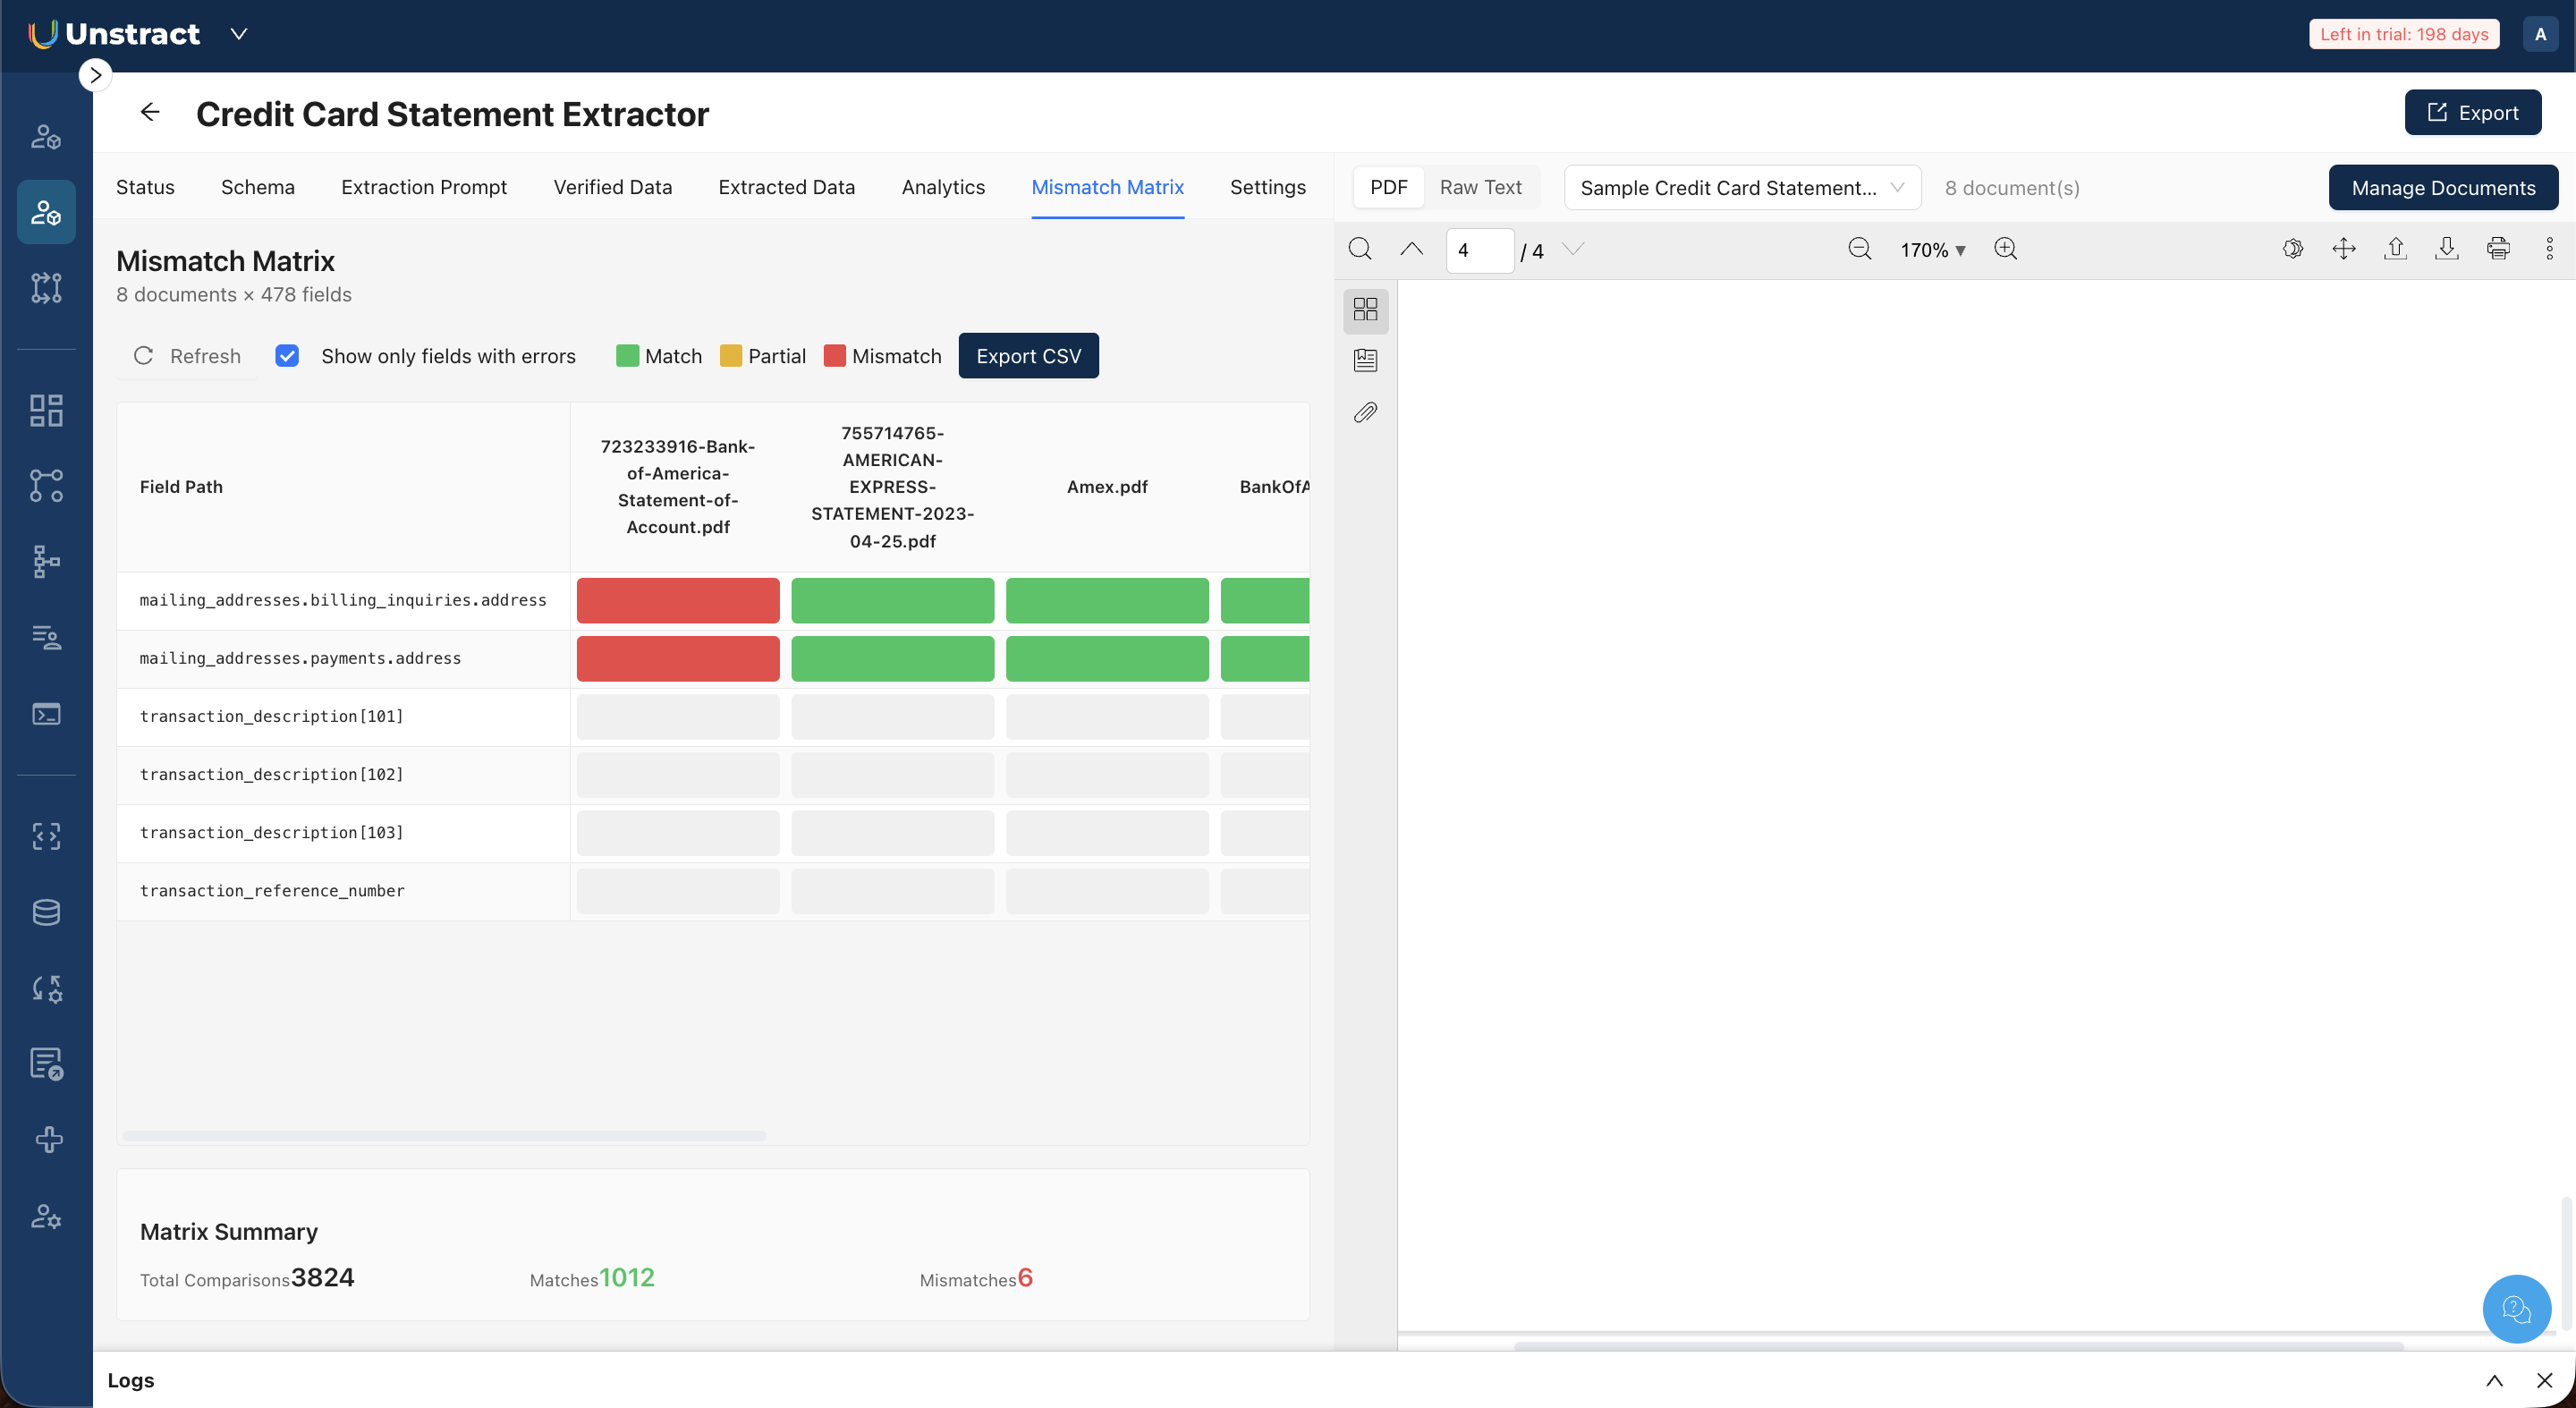
The matrix is a grid where rows represent field paths (including nested fields like mailing_addresses.billing_inquiries.address) and columns represent documents. Each cell is color-coded:
- 🟢 Green: Match (extracted value matches verified value)
- 🟡 Yellow: Partial match
- 🔴 Red: Mismatch
Use Show only fields with errors to filter the matrix to rows that have at least one mismatch or partial match. The Matrix Summary at the bottom shows total comparisons, total matches, and total mismatches.
Click Export CSV to download the matrix data for offline analysis.